Home
Glasnost Tests
Create a new test
Run your own server
Results
Contact
Home
Glasnost Tests
Create a new test
Run your own server
Results
Contact
Click here to download and learn more about Tcpdump.
tcpdump -s 0 -w <output_file> -i <network_interface> <filter>
You need the "-s 0" option to collect the entire packets' payload. The filter description <filter> is used to select the traffic you want to focus on. For example, use "tcp port 80" to capture Web traffic only.
Click here to download and learn more about Wireshark.
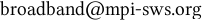
From the main window, click the "Capture Options" button:
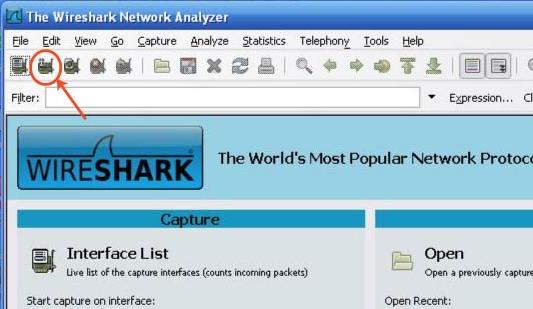
This will open the "Capture Options" window. There are three things you need to pay attention to here:
First, select the right network interface from the interface combo box. Then, make sure the "Limit each packet to" check-box is unchecked, so that Wireshark will collect the entire payload of each packet. Finally, select the filter for your application using the "Capture Filter" option.
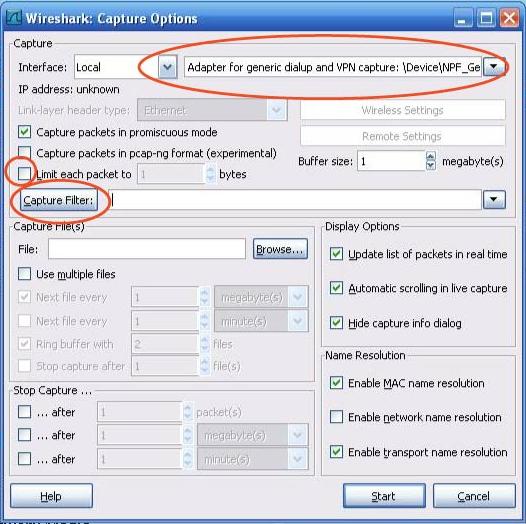
Now you are ready to start/stop the trace capture process, using the "Start" and "Stop" buttons highlighted below:
When you are done collecting the packets, save the trace to a file by opening the "File" menu and clicking on "Save".
In case you have questions about this tool or our research, please contact us: